Commercial Insurance Costs by State: The 5x Difference Small Business Owners Don't Know About
A small business with $500,000 in payroll and 20 employees pays $2,500 per year for workers' compensation insurance in North Dakota — and $12,600 in Hawaii. Same coverage, same risk profile, same business. The only variable is the state.
The Headline Finding
We analyzed commercial insurance costs across all 50 US states using data from the Oregon Department of Consumer and Business Services, the Bureau of Labor Statistics, Insureon, CPK Insurance, MoneyGeek, and Google Trends. The goal was simple: answer the question every small business owner asks when they're picking a state — how much will insurance cost me?
The answer, it turns out, depends enormously on where you set up shop. A business with $500,000 in payroll pays anywhere from $2,500 per year (North Dakota) to $12,600 per year (Hawaii) for identical workers' compensation coverage. That's not a small difference — it's the equivalent of a full-time employee's salary.
The same pattern holds across general liability and commercial auto. Businesses in the Northeast consistently pay 40–60% more than businesses in the Mountain West and Northern Plains for the same coverage. And in some categories, the spread between the cheapest and most expensive state is more than 4x.
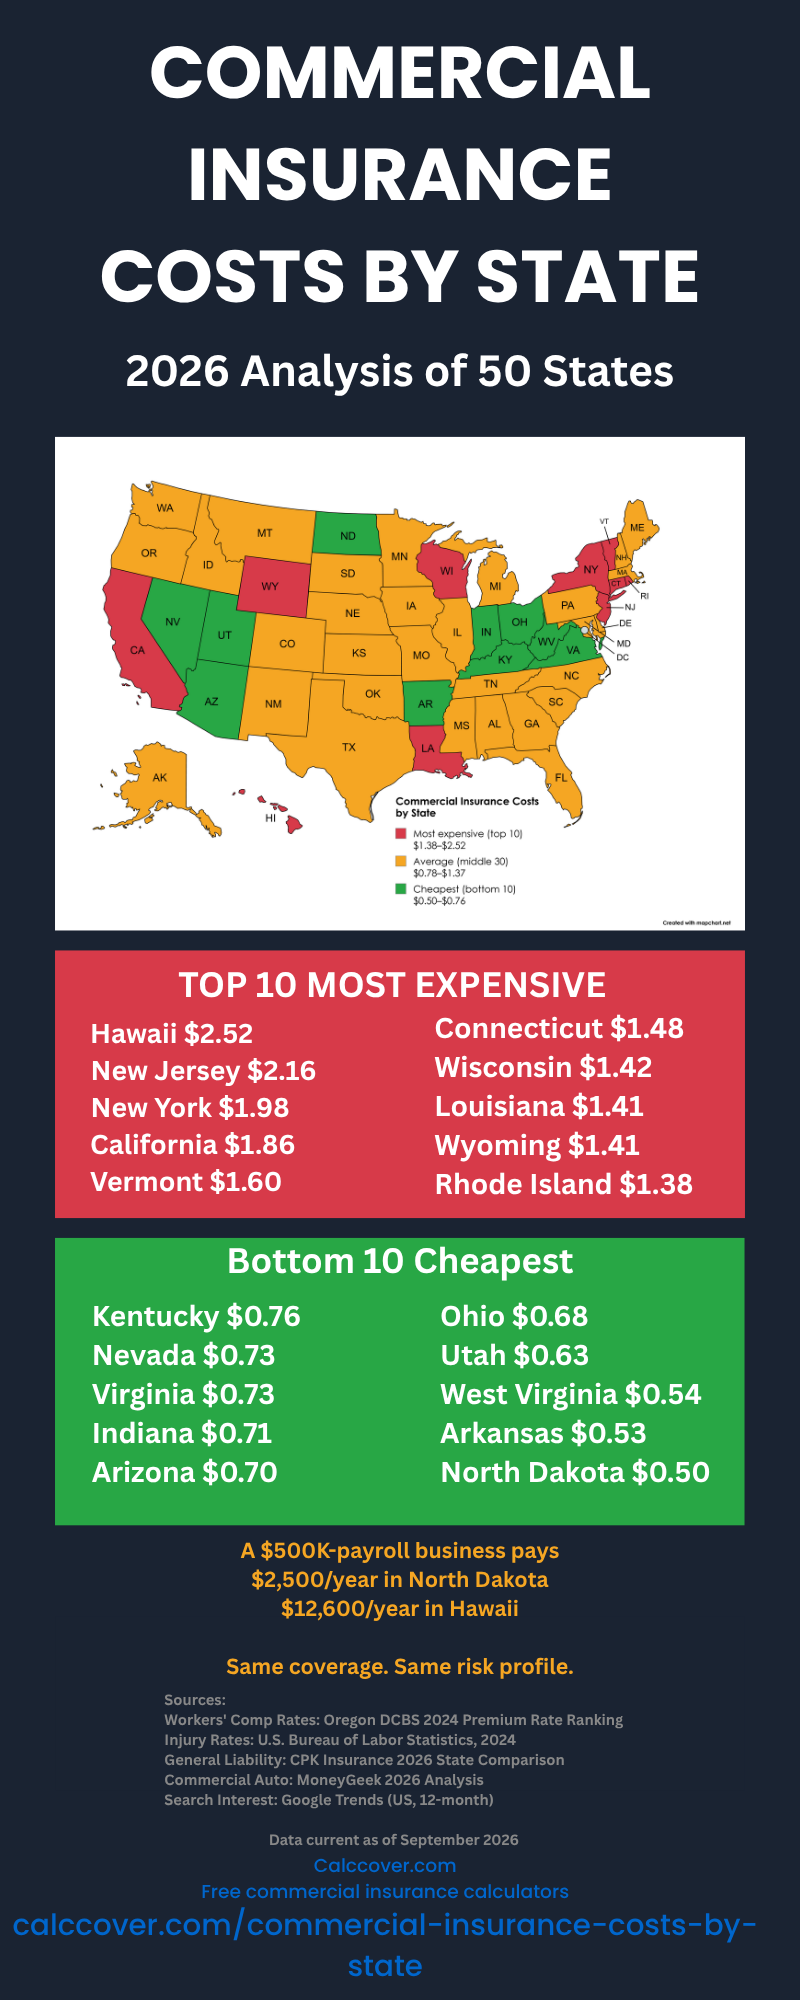
Top 10 Most Expensive States for Workers' Comp
Ranked by rate per $100 of payroll (Oregon DCBS 2024 data):
| Rank | State | Rate per $100 Payroll | Annual Cost on $500K Payroll |
|---|---|---|---|
| 1 | Hawaii | $2.52 | $12,600 |
| 2 | New Jersey | $2.16 | $10,800 |
| 3 | New York | $1.98 | $9,900 |
| 4 | California | $1.86 | $9,300 |
| 5 | Vermont | $1.60 | $8,000 |
| 6 | Connecticut | $1.48 | $7,400 |
| 7 | Wisconsin | $1.42 | $7,100 |
| 8 | Louisiana | $1.41 | $7,050 |
| 9 | Wyoming | $1.41 | $7,050 |
| 10 | Rhode Island | $1.38 | $6,900 |
The pattern is stark. Six of the ten most expensive states are in the Northeast or Hawaii. These states share three characteristics: high litigation rates, generous statutory benefits, and concentrated insurance markets with less competition.
Top 10 Cheapest States for Workers' Comp
| Rank | State | Rate per $100 Payroll | Annual Cost on $500K Payroll |
|---|---|---|---|
| 41 | Kentucky | $0.76 | $3,800 |
| 42 | Nevada | $0.73 | $3,650 |
| 43 | Virginia | $0.73 | $3,650 |
| 44 | Indiana | $0.71 | $3,550 |
| 45 | Arizona | $0.70 | $3,500 |
| 46 | Ohio | $0.68 | $3,400 |
| 47 | Utah | $0.63 | $3,150 |
| 48 | West Virginia | $0.54 | $2,700 |
| 49 | Arkansas | $0.53 | $2,650 |
| 50 | North Dakota | $0.50 | $2,500 |
The cheapest states cluster in two regions: the Mountain West (Utah, Arizona, Nevada) and the Northern Plains (North Dakota, Arkansas). Both regions share business-friendly regulatory environments and — in North Dakota and Wyoming's case — state-run workers' comp monopolies that compress costs.
The Northeast Premium: A 40–60% Cost Penalty
Look at the workers' comp map and one pattern jumps out immediately: the Northeast is consistently the most expensive region in the country. Eight of the nine Northeastern states — New Jersey, New York, Vermont, Connecticut, Massachusetts, New Hampshire, Rhode Island, Pennsylvania, Maine — have rates above the national median.
A business with $500,000 in payroll pays roughly $3,900 per year in Ohio. That same business in New Jersey pays $10,800. The only difference is geography. Over a 10-year horizon, that's $69,000 in additional operating cost — enough to fund a full-time hire.
The reason isn't that workers in New Jersey are more accident-prone. It's that Northeast states have higher statutory benefit levels, more generous disability payouts, and a more active plaintiffs' bar. Those factors drive up the cost of every claim, which drives up the base rate for every employer.
New York's Triple Crown: Most Expensive in Every Category
New York appears in the top 5 most expensive states for every major line of commercial insurance:
| Line of Insurance | New York Rank | New York Cost |
|---|---|---|
| Workers' Comp Rate | #3 | $1.98 per $100 payroll |
| General Liability | #2 | $1,296 per year |
| Commercial Auto | #1 | $7,996 per year |
No other state ranks in the top 5 across all three lines. If you're a small business owner in New York, you're paying a premium that's structural, not incidental. Moving your business 3,000 miles to North Dakota would cut your total insurance bill by roughly 60%.
The "Weather Tax" on Commercial Auto
Commercial auto insurance premiums correlate strongly with severe weather and traffic density. The five most expensive states for commercial auto:
| Rank | State | Annual Premium | Primary Cost Driver |
|---|---|---|---|
| 1 | New York | $7,996 | Traffic density, litigation |
| 2 | Louisiana | $7,317 | Hurricane risk, poor roads |
| 3 | Florida | $6,920 | Hurricane, no-fault system |
| 4 | Michigan | $6,356 | No-fault, high medical costs |
| 5 | California | $6,203 | Traffic density, litigation |
The cheapest commercial auto state — Maine at $3,298 per year — costs less than half of what New York businesses pay. Maine combines low traffic density, minimal severe weather, and a favorable regulatory environment. If commercial auto is a major expense for your business, the geographic arbitrage here is significant.
What Actually Drives the Variation (It's Not What You Think)
The most surprising finding in the data: workplace injury rates do not predict workers' comp premiums.
Maine has the highest nonfatal injury rate in the country (4.1 per 100 full-time workers), but a mid-tier workers' comp rate ($1.37). North Dakota has a higher-than-average injury rate (3.5) but the cheapest workers' comp in America ($0.50). California has a below-average injury rate (2.9) but the fourth-most-expensive workers' comp ($1.86).
The correlation between injury rates and workers' comp premiums is weak and statistically insignificant. What actually drives the cost is regulation: statutory benefit levels, the ease of filing claims, the presence of state-run monopolies, and the litigation environment.
For business owners, this means: when you evaluate a state for expansion, look at the insurance regulatory environment, not the safety statistics. A state with higher injury rates but a business-friendly workers' comp system will cost you less.
How to Use This Data
If your commercial insurance rates are meaningfully above your state's average, you're probably overpaying. Three things to check:
- Run your actual numbers. State averages are benchmarks. Your specific rate depends on your industry class code, payroll, claims history, and carrier. Use our free calculators to see where you should be.
- Shop multiple carriers. Rates for the same coverage vary 20–30% between carriers in the same state. Loyalty to a single carrier is expensive.
- Consider the geographic arbitrage. If you're planning an expansion or relocation, the difference between the cheapest and most expensive states is often 40–60%. That's enough to shift the economics of a hiring decision.
Frequently Asked Questions
Why is workers' comp so much cheaper in North Dakota?
North Dakota operates a state-run workers' compensation monopoly — Workforce Safety & Insurance — which eliminates the marketing, overhead, and profit margins that private carriers build into their rates. The state also has a small, homogeneous workforce with a lower concentration of high-risk industries like construction and manufacturing. The combination produces the lowest rate in the country.
Do these numbers apply to my specific business?
Only as a benchmark. The rates in this study reflect an average mix of industries weighted toward clerical and light-service work. High-risk industries — construction, roofing, trucking, manufacturing — pay 2–5x the state average. Low-risk industries — offices, professional services — pay 40–60% below the average. Use our free calculators with your specific inputs for a more accurate estimate.
How often do commercial insurance rates change?
Workers' comp rates are typically reset annually by each state's insurance department, with some states updating quarterly. General liability and commercial auto rates are set by each carrier and can change on renewal. The data in this study reflects rates effective January 2024 through September 2026. The general pattern of state-to-state variation is stable year over year, even when absolute rates shift.
Can I just move my business to a cheaper state?
The rate is only one factor. You need to weigh taxes, labor costs, cost of living, regulatory burden, access to talent, and customer proximity. A business saving $8,000 per year on insurance but paying $20,000 more in state and local taxes is worse off. Use the insurance data as one input in a broader decision.
Why does the study exclude loss ratio data?
Workers' comp loss ratios (claims paid ÷ premiums collected) vary significantly year over year and are not consistently reported at the state level by public sources. Including them would reduce the reliability of the study. The rates themselves — what a business actually pays — are more stable and more useful for business planning.
Methodology
This study analyzes commercial insurance costs across all 50 US states using publicly available data from multiple industry sources. Workers' compensation rates per $100 of payroll come from the Oregon Department of Consumer and Business Services (DCBS) 2024 Premium Rate Ranking. Annual workers' comp premiums are aggregated from Insureon, NEXT Insurance, and Hiscox published rate guides (2025–2026) for small businesses with 3–5 employees, clerical/retail class code, and clean claims history.
General liability costs are based on CPK Insurance's 2026 state-by-state rate comparison for $1M/$2M coverage limits. Commercial auto premiums are sourced from MoneyGeek's 2026 analysis of $1M CSL liability coverage for commercial truck policies.
Nonfatal workplace injury rates come from the Bureau of Labor Statistics Survey of Occupational Injuries and Illnesses (2024). Eight states (Florida, Georgia, Idaho, Mississippi, New Hampshire, North Dakota, Rhode Island, and South Dakota) do not report to this survey; for these states, the 2024 national private industry average of 2.3 per 100 FTE workers was applied. Search interest data is from Google Trends (past 12 months, United States).
All figures are estimates. Actual premiums depend on industry class code, payroll, claims history, coverage limits, and individual carrier underwriting.
Download the Full Dataset
All 50 states. Workers' comp, general liability, commercial auto, injury rates, search interest, and business counts.
Open the Google Sheet →